How the math of viral growth actually works
This article is intended for people trying to develop the intuition behind the k-factor, and learning how to spot the bullshit.
When I started reading up on k-factor, I noticed most blog posts explicitly skipped the “technical” aspects of calculating viral growth.
In undergrad (physics and math), I became a huge believer that understanding actual math in derivations of equations is necessary to understand the concepts the equations describe. This is also part of my strongly held belief that only trained scientists should be setting government scientific policy, but anyway…
In other words, the “technical” parts matter.
So I’m going to break down the “technical” parts of virality into bite-sized pieces.
Math degrees are not required to keep reading.
Get ready… it’s not hard.
First, let’s define k
k = the average number of new users that each existing user gets onto the product.
In other words, if I add one new user to my product, k tells me how many more new users that user will add to my product on average. It’s a measure of viral growth (user one adds two more users, they each add two more, they each add two more, etc. — suddenly everyone’s got it).
The main mechanism that drives k, as I will explain in more detail below, is referral (aka. invitations). But technically, there’s nothing inherent in the concept of k that require invitation features to be built into the product. k is higher level than that — it counts all types of methods that users utilize to get other people on the product.
At a high level, k tells you if your user base can grow itself without any further paid acquisition of users.
- 0 ≤ k < 1 ⟹ user base will not grow itself because each user you add, on average, will fail to add another full user. This is sublinear (less than linear)growth.
- k = 1 ⟹ user base will grow itself linearly because each user you add, on average, will add one more user.
- k >1 ⟹ user base will grow itself exponentially because each user you add, on average, will add more than one more user (and that new user will add another, and so on). This is superlinear (more than linear) growth.
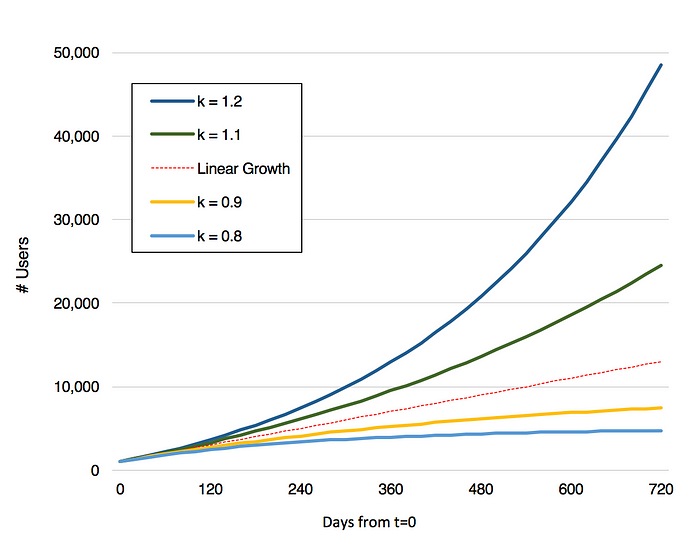
k, calculated properly and fairly, can be a strong signal of app success. But critics rightly point out that it’s susceptible to all sorts of jiggery-pokery (both in terms of hacking the mechanics of k and calculating it). I’ll dive into this in part 4 of this post.
Second, let’s understand k a little deeper
If you’ve ever started to calculate k, you probably hit the first question: over what time period should I calculate k?
Picking the time period can significantly change your result.
Recall, k = the average number of new users that each existing user gets onto the product.
For the example, I’m going to be very high level about “getting new users” on an app. This makes it pretty easy to calculate k:
k = # new users that existing users got onto the app / # of existing users (I’ll refer to these as numerator and denominator)
Let’s walk through a simple example where users join an app over 3 months.
Month 1
Activity: A, B, and C sign up from ads … yay!

k @ end of month 1 = 0 (since A, B, and C, haven’t converted any new users)
Month 2
Activity: D, E, and F sign up from ads … yay! 6 existing users at the end of month 2.

k @ end of month 2 = 0 (since A, B, C, D, E, and F haven’t converted any new users)
Month 3
Activity: A, D, and E successfully get one new user on the product each (G, H, and I, respectively). At the same time, J, K, and L sign up from ads. Then, G gets a new user, M on the product too. Yay, 13 users at the end of month 3!

k @ end of month 3 = … okay, let’s think about this…
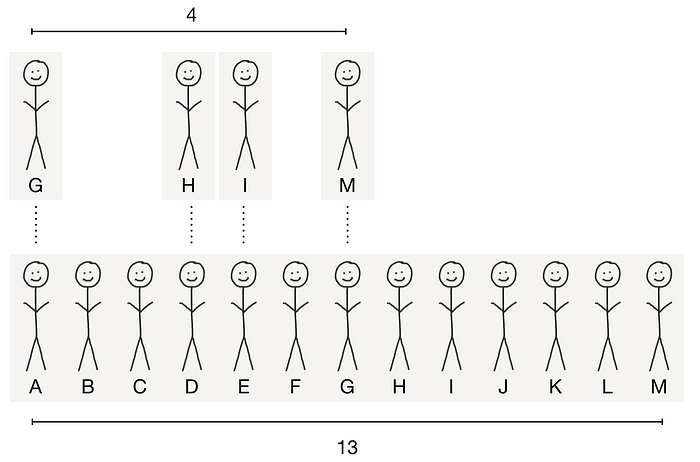
At the end of month 3, there are 13 users. 6 of them were “mature” (users for at least a month). 7 of them were not mature (users for less than a month), of whom 3 came from ads, and 4 came from existing users.

We know the number of new users that existing users got on the product is 4 (G, H, I, and M). Yay! That’s the numerator.
Now you need the number of new users that the average user got onto the product. No problem, just divide the numerator by the denominator (the number of existing users). So, do you divide by…
- 6 (# users at end of month 2), or
- 9 (# of users that got themselves on the product at end of month 3), or
- 13 (# users at end of month 3)?
Well… it depends. Any could be true. A different number could also be true. This is where you have to use judgement.
The denominator depends on how long it takes for a user to get another on the product. This is called the “cycle time” (read more below).
Hypothetical A: k where cycle time = 2 hours
As a hypothetical, let’s say the product is so immediately addictive that you see invitations (and other types of actions to attract other users) being sent very quickly (say an hour). Furthermore, those invitations (or other types of actions to attract other users) get those other people on the product very quickly (say another hour). In this case, you might say that you should divide the numerator by 13, since all 13 people have had a reasonable chance to get other people on the app. In this case, your k-factor is 4/13 = 0.31. Okay, not great!
Hypothetical B: k where cycle time = 1 month
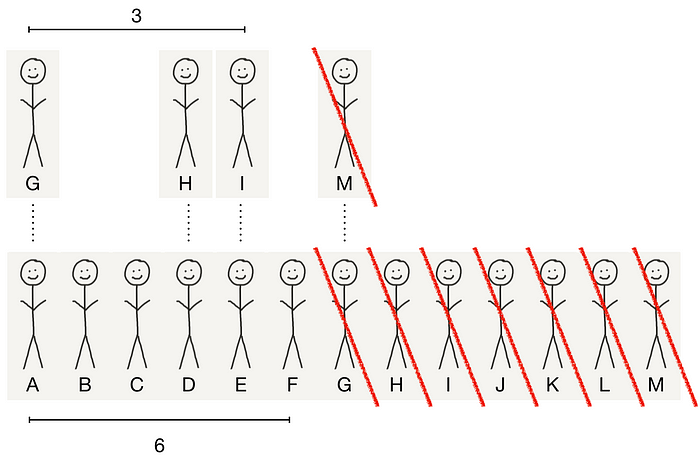
Another hypothetical. Let’s say the average invitation timeframe is exactly a month. Then, at the end of month 3, only 6 users (A, B, C, D, E, and F) would have had a chance to invite people. So you can divide your numerator by 6. In this case, your k-factor is 4/6, or 0.67, right? Nooope! If you do this, you need to ensure that your numerator excludes new users that were invited (or otherwise attracted) by users under a month old that got on the product. So your numerator has to exclude M, who was invited by G. In this case, your k-factor is 3/6 = 0.5. Yay, it’s larger than 0.31!
Hypothetical C: k in months 2 onwards; cycle time = 1 month
What if the product changed between month 1 and 2? Well… yeah, this happens in the real world. Cohort analysis separates users who had a significantly different product experience than another. So maybe you’re not interested in usage from users who joined in month 1, since they had a very different experience. Fair enough… though you’ll have to justify that the difference in experience was actually determinative on the core action of inviting people, which is dubious in this case since A invited someone.
Whatever, let’s just go with it. The denominator only contains existing users from month 2 (D, E, and F — i.e. exclude month 1 users because they were in a different cohort, and exclude month 3 users because they haven’t had a full cycle time). Then the numerator should only include new users who month 2 users got on the product (users H and I). In this case, your k-factor is 2/3 = 0.67. Yay, it’s closer to 1!
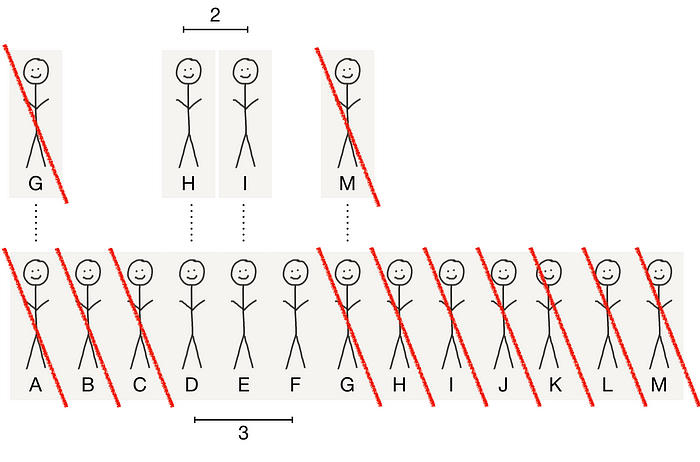
Okay, so your k-factor is somewhere between 0.31 and 0.67, depending on how you finagle the numbers. Astute prospective investors will press you on these assumptions.
Note: an astute investor would disagree with everything I’ve just said because the sample size is tiny. But anyway…
Third, let’s understand k a different way
Recall, k = the average number of new users that each existing user gets onto the product.
Let’s walk through an example in which we calculate k for a period in which you have statistically significant numbers and in which the product hasn’t significantly changed.
Let’s also say that you have just one method for a user to get on the product, which is an “invitation”.
Note: An invitation can be one user named Jill just hanging out with a guy and saying, “Hey, check out this product!” And the guy might say, “Ehh, not right now.” Sad! This invitation did not convert the guy. The invitation might also be an email or text. At any rate, let’s lump all different ways of inviting people and just call it one thing “invitations”, and let’s say we know about all those invitations that happened, whether online or offline. And let’s say we know, on average, how well these invitations convert the recipients to start using the app.
Cool, we’ve piled on all these important assumptions. Real life isn’t like this, but anyway…
Formula for k
What’s k? For easy calculation, people typically write it down like this: k = i*c
- i = number of invitations sent per existing user. 0 ≤ i. This is # of invitations / # of users.
- c = conversation rate on the invitations (i.e. the % at which invitations actually convert the recipients into users). 0 ≤ c ≤ 1
Let’s walk through an example.
First, count up all those invitations that happened in the period we’re looking at. Hey, it’s 1,000!

To calculate i, you need to know how many users you had in the period. Let’s say it’s 800.

Therefore: i = 1,000/800 = 1.25
Next, say that just 1/10 of those invitations were actually accepted. So your 1,000 invitations got 100 new users on the product.

Therefore: c = 1/10 = 0.1
Therefore: k = i * c = 1.25 * 0.1 = 0.125.
Equivalently, you can say that 800 existing users got 100 new users on the product, so k = 100/800 = 0.125.
Fourth, let’s see what k means
To get truly viral growth, meaning that you superlinearly acquire users through the user base growing itself, you need k >1. In other words, every user you add subsequently adds at least another user.
If adding users actually grows your business, and if you calculated k using assumptions that are actually realistic, then k>1 is a powerful signal of success. In this case, you’ll have to turn your attention to the viral cycle time, which I’ll cover later in this post.
Interpreting k actually requires a deep understanding of what’s going on. Say k > 1. Does this guarantee success? Maybe it takes goddam forever to invite someone. Maybe your invited users have bad experiences and leave immediately after sending invitations. Maybe your market is not infinite and your exponential growth will slow down soon. Maybe users invite people because you bombard them with bright buttons to invite people, but they didn’t really want to. Maybe your product just invites people without telling your users but everyone hates it. Maybe you incentivize invitations and acceptances by literally paying cash to people who are inviters and invitees but they don’t add value to the business. By the way, there are real examples of apps that do all these things.
Really, there are very few general claims one can make about k without understanding the specifics of the product. Here are some quotes from things I’ve read on k:
1. “Having a positive k-factor means you have product market fit.”
2. “A k-factor less than one is worthless.”
3. “Having a positive k-factor means you’re giving your customers a good experience.”
4. “Having a k-factor over one means you’ll have exponential growth.”
Note: “Positive” k-factor used colloquially means k>1.
Note: If k < 0, then that would mean the average existing user kicks off another user — it’s possible but I can’t think of an example.
Okay. Lots of stuff here. Well… some of these have some truth. Let’s dive into the logic here.
#1. Having a positive k-factor means you have product market fit.
The real issue with this claim is that it doesn’t speak at all to the actual determinants of PMF. PMF means you have a market (i.e. a group of people who have a pain) and a product you can provide to that market that solves the pain. A more fool-proof model to show PMF is if your retention curves asymptote to the x-axis (meaning some users just keep using your product).
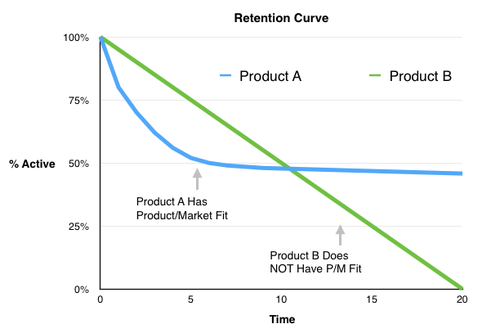
At worst, k is a completely orthogonal concept to hitting PMF. For example, some apps literally pay their users to send invitations that are accepted. If you see a lot of accepted invitations that come from this scheme, this merely proves that there is a market of people who want to get paid. It has nothing to do with the actual product and the actual pain.
At best, k is an insufficient and unnecessary condition of hitting PMF, but it’s somewhat related. In a best-case scenario, you’ve calculated k using fair assumptions, you see users who are invited actually retain on the product, and, most importantly, inviting people is actually a core action for a user to realize the value of the product (such as where there are network effects). If all these things are true, then you’ve got a killer product. But again, the determinant of PMF is actually the retention number. If inviting people is actually confounded with realizing the value of the product, then it’s related. But it’s not a sufficient or necessary condition.
#2. A k-factor less than one is worthless.
A business can be profitable if it can acquire customers at a cost that is less value of the customer (i.e. what the customer pays the business). In other words, CAC < LTV = $$$. This model is most powerful applied in an enterprise sales scenario because CAC and LTV are easy to calculate, but it’s generally true for all types of business.
k < 1 doesn’t affect your actual paid customer-acquisition-cost, but it’s still worth something. Let’s say I pay $1,000 to acquire 10 customers, and collectively those 10 customer successfully invites 1 other customer. So k = 1/10, CAC = $100 for the 10 customers initially acquired, and the “blended” CAC = $1,000/(10+1) = $91. This absolutely ads value to your business (i.e. you’re saving $9/user).
That said, to a VC who only invests in freemium or free-end-user businesses, a k< 1 is actually worthless to them. Why? If they’ve already disallowed all possible businesses that rely on paid acquisition, then only businesses that can thrive without paid acquisition are in the scope of possibility.
#3. Having a positive k-factor means you’re giving your customers a good experience.
Obviously, you’re more likely to refer someone to a product you think is actually good.
But, as a product manager, I’ve learned that k can be high but users can still have a bad experience. What if sending 5 invitations was mandatory to onboard to the product (annoying! But you can push users through with a big enough promise). What if the UX to send invitations is confusing and frustrating? You can still get high k while giving users a bad experience.
Furthermore, with social apps you need users to invite others in order to have a good experience. In this case, invitations are a cause of a good experience, not the other way around.
Also, this statement doesn’t work in reverse (i.e. good user experience doesn’t imply that k >1). Improving the app experience could bump k from 0.1 → 0.5, or 0.9 → 0.95, but still be below 1.
#4. Having a k-factor over one means you’ll have exponential growth.
This can be true, but it can only be true for a limited time. Exponential growth must peter off once you start to eat up your market.
But there are two other problems with this statement.
First I learned from from Kristina Shen, a BVP partner who helped me model our business in the early days of Helpful. She advised me to be very careful if I were to model a positive k (let alone a k > 1). This is because your models can grow very quickly if every user adds another user. The reality is that invitations can have a long cycle time, so “exponential growth” might actually appear to be linear over the forecastable time period. Furthermore, exponential growth is extremely sensitive to the inputs, so small inaccuracies in k can wildly spiral out of control.
Second, k > 1 might exponentially grow a thing you don’t care about. This would be the case if your users don’t provide value (such as if they invited users and then left, or users can’t be monetized).
Viral cycle time
Recall: for every user your add, you add k more.
This means k is a variable for how much you compound your user base.
Therefore, we can frame viral growth as a compounding problem, which leads to a key insight: the rate of compounding is equally (if not more) important than the magnitude of compounding.
The compounding rate is the viral cycle time:
p = viral cycle time = how long it takes, on average, for a user to get another user on the product
In order to see how this variable operates, we need to look at the users over time. See below.
Users as a function of time
Kevin Lawler (here) wrote out a formula for users as a function of time. Do take a look at it if you’re interested in the math.

- U(t) = users at time t
- U(t=0) = U(0) = users at time 0
I won’t reproduce the derivation here, but I will demonstrate how a fast cycle time grows users vis-a-vis k using the sensitivity table below.
These results are illuminating.
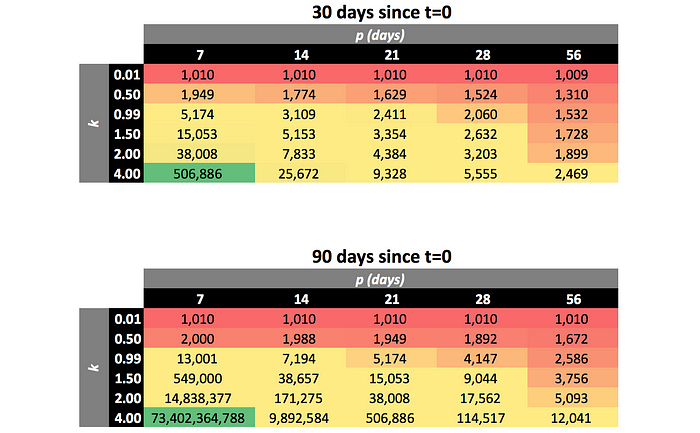
In these examples, I’ve shown the number of users 30 days in (top) and 90 days in (bottom), each with different assumed values of k and p. U(0) = 1,000 in these examples.
The values of k are listed in the black boxes on the left, and the values of p (in units of days) are listed in the black boxes on top. The value shown in each corresponding cell shows the number of users calculated using each of the assumptions. Read more about interpreting sensitivity tables here.
Two Takeaways
- k < 1 produces sublinear growth. If k ≈ 1, the numbers start to get exciting. If you have k < 1, the highest growth in # users will come from increasing k.
- Once k becomes greater than 1, it becomes more valuable to reduce the cycle time than continue to increase k. This is because k > 1 produces superlinear growth, so the most growth you can get is to compound k at a higher frequency.
Note: the numbers blow up once you get to a 7-day cycle time. This is just to show extremes — it’s not realistic.
Alright, so…
- “Viral” growth means k > 1
- k < 1 can still be valuable (viral growth is phenomenal, but it’s not the only way to win a market)
- Invitations should be tied to the core value of the product in order for the k to be meaningful
- Low viral cycle time is massively important to achieve fast growth
- Virality doesn’t compound if the invited users who come don’t stick around long enough to feed the next round of viral adoption. If you calculate k accurately and fairly, the value of k should account for this behaviour
- The number of invitations that your users send may change over their life cycle
- Invitations might be an action that occurs before value is realized
- Viral growth doesn’t last forever, so make your product appeal to a big market if you want to really reap the rewards
David Pardy is co-founder and Chief of Staff at Helpful. He works on product.
